KesGPT-Image-2图片数据可视化
GPT-Image-2 案例 · 地理分级统计产量地图
来自“数据可视化”精选展示的 GPT-Image-2 参考案例,适合检索“地理分级统计产量地图”方向的生成效果。
Hasil
Latar Kes
来自 GPT-Image2-Skill README 的精选展示条目,适合作为“数据可视化 / 地理分级统计产量地图”方向的站内参考案例。
Kandungan Prompt
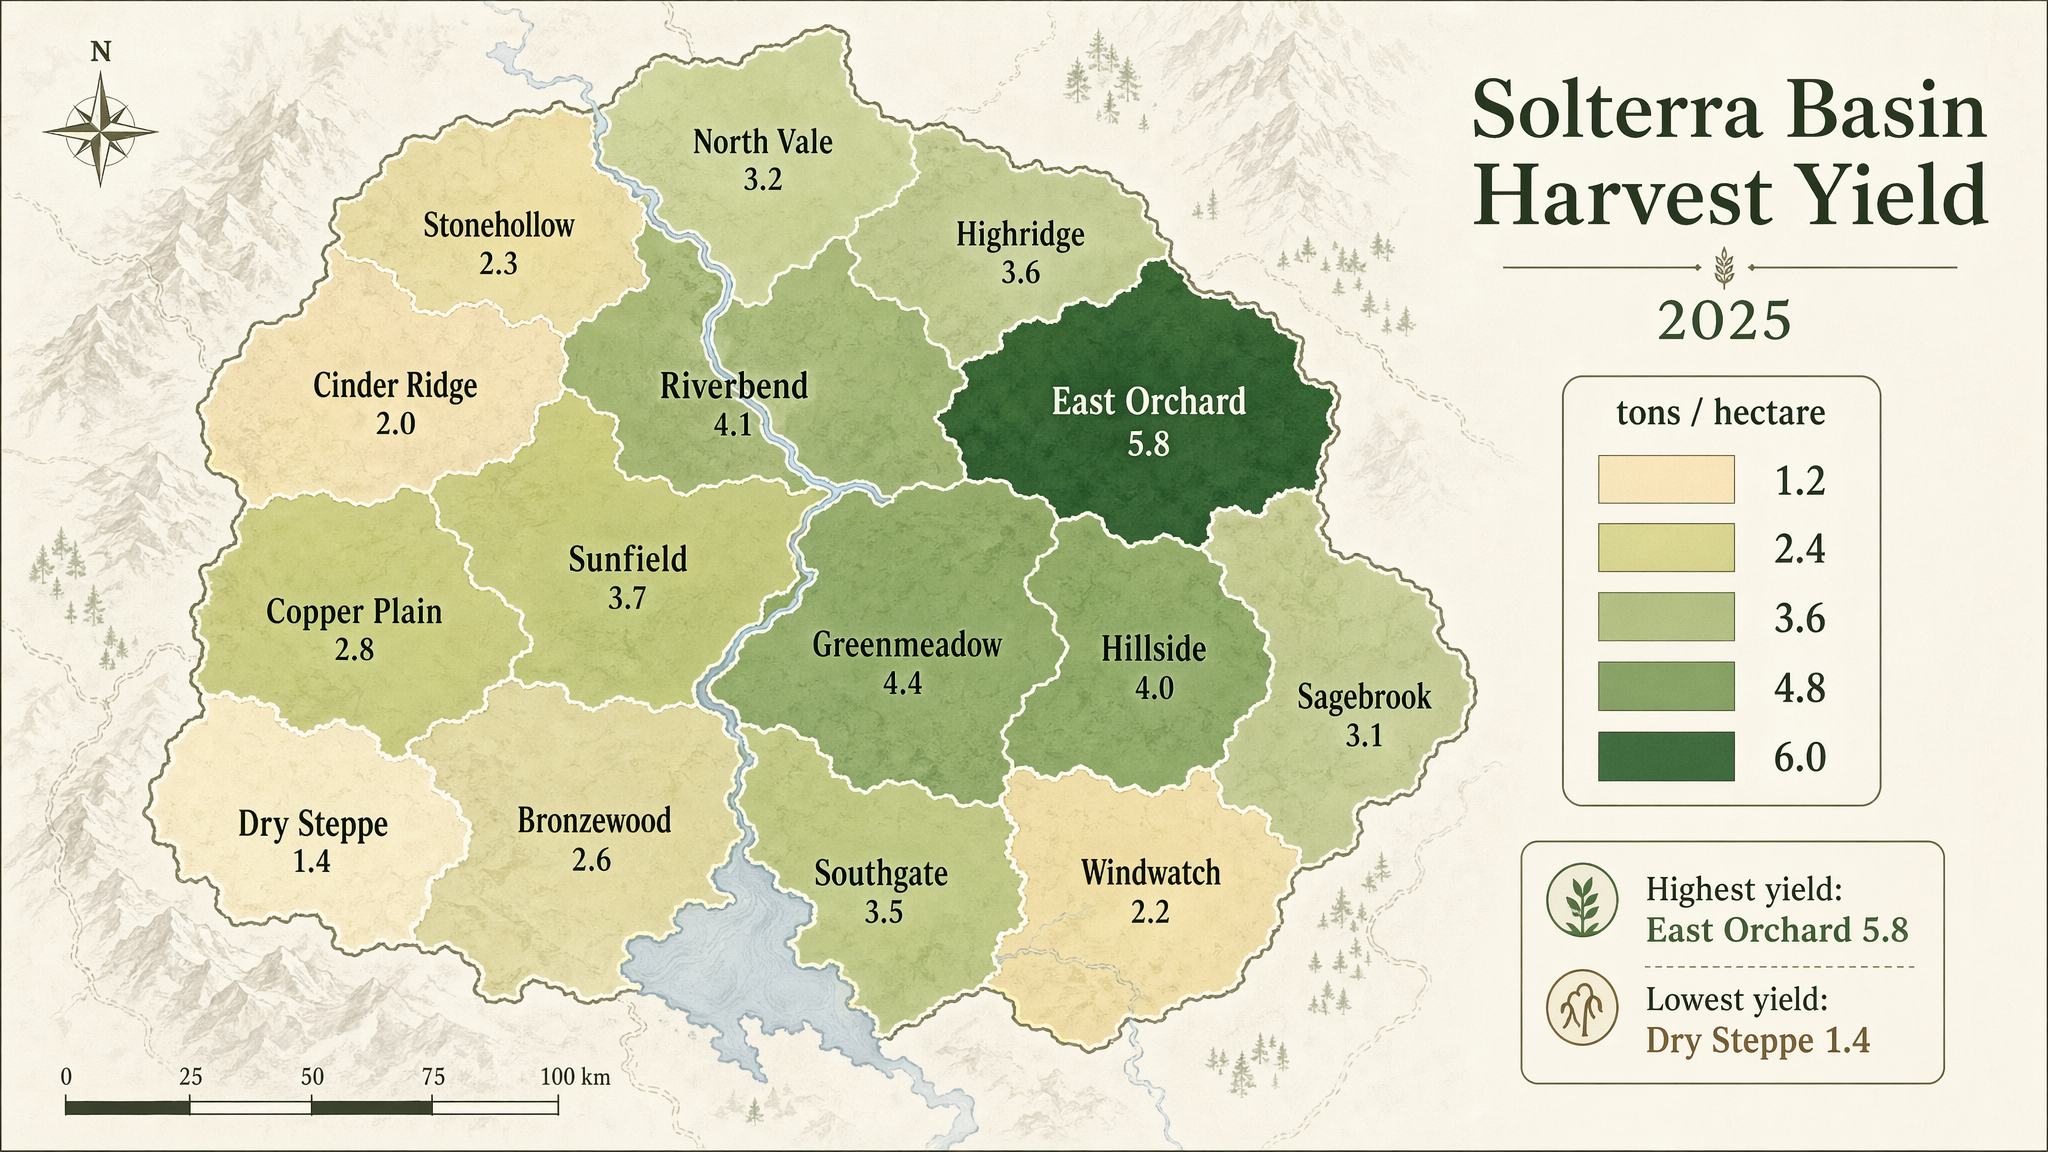
Produce a polished geographic choropleth map infographic of a fictional agricultural region called the Solterra Basin, showing harvest yield by district. Use a minimalist cartographic style on an off-white background with muted terrain hints and a sequential palette from pale sand to deep green. The map should include 14 clearly separated districts with clean borders, crisp labels, and a right-side legend. Include in-image text: "Solterra Basin Harvest Yield", "2025", and legend title "tons / hectare". Label districts with names such as "North Vale", "Riverbend", "Copper Plain", "East Orchard", and "Cinder Ridge". Include legend values "1.2", "2.4", "3.6", "4.8", and "6.0". Add a compact annotation box reading "Highest yield: East Orchard 5.8" and "Lowest yield: Dry Steppe 1.4". Prioritize clean typography, accurate map-like geometry, balanced composition, subtle cartographic detail, and publication-grade infographic clarity.
Catatan Hasil
这个案例已从 GPT-Image2-Skill README 迁入 AIPlusLab `/prompts`,方便在站内直接检索、浏览和复用。
ModelGPT-Image-2
Kategori图片
JenisKes
Sumberopenai