KesGPT-Image-2图片数据可视化
GPT-Image-2 案例 · 小多重气候网格
来自“数据可视化”精选展示的 GPT-Image-2 参考案例,适合检索“小多重气候网格”方向的生成效果。
Hasil
Latar Kes
来自 GPT-Image2-Skill README 的精选展示条目,适合作为“数据可视化 / 小多重气候网格”方向的站内参考案例。
Kandungan Prompt
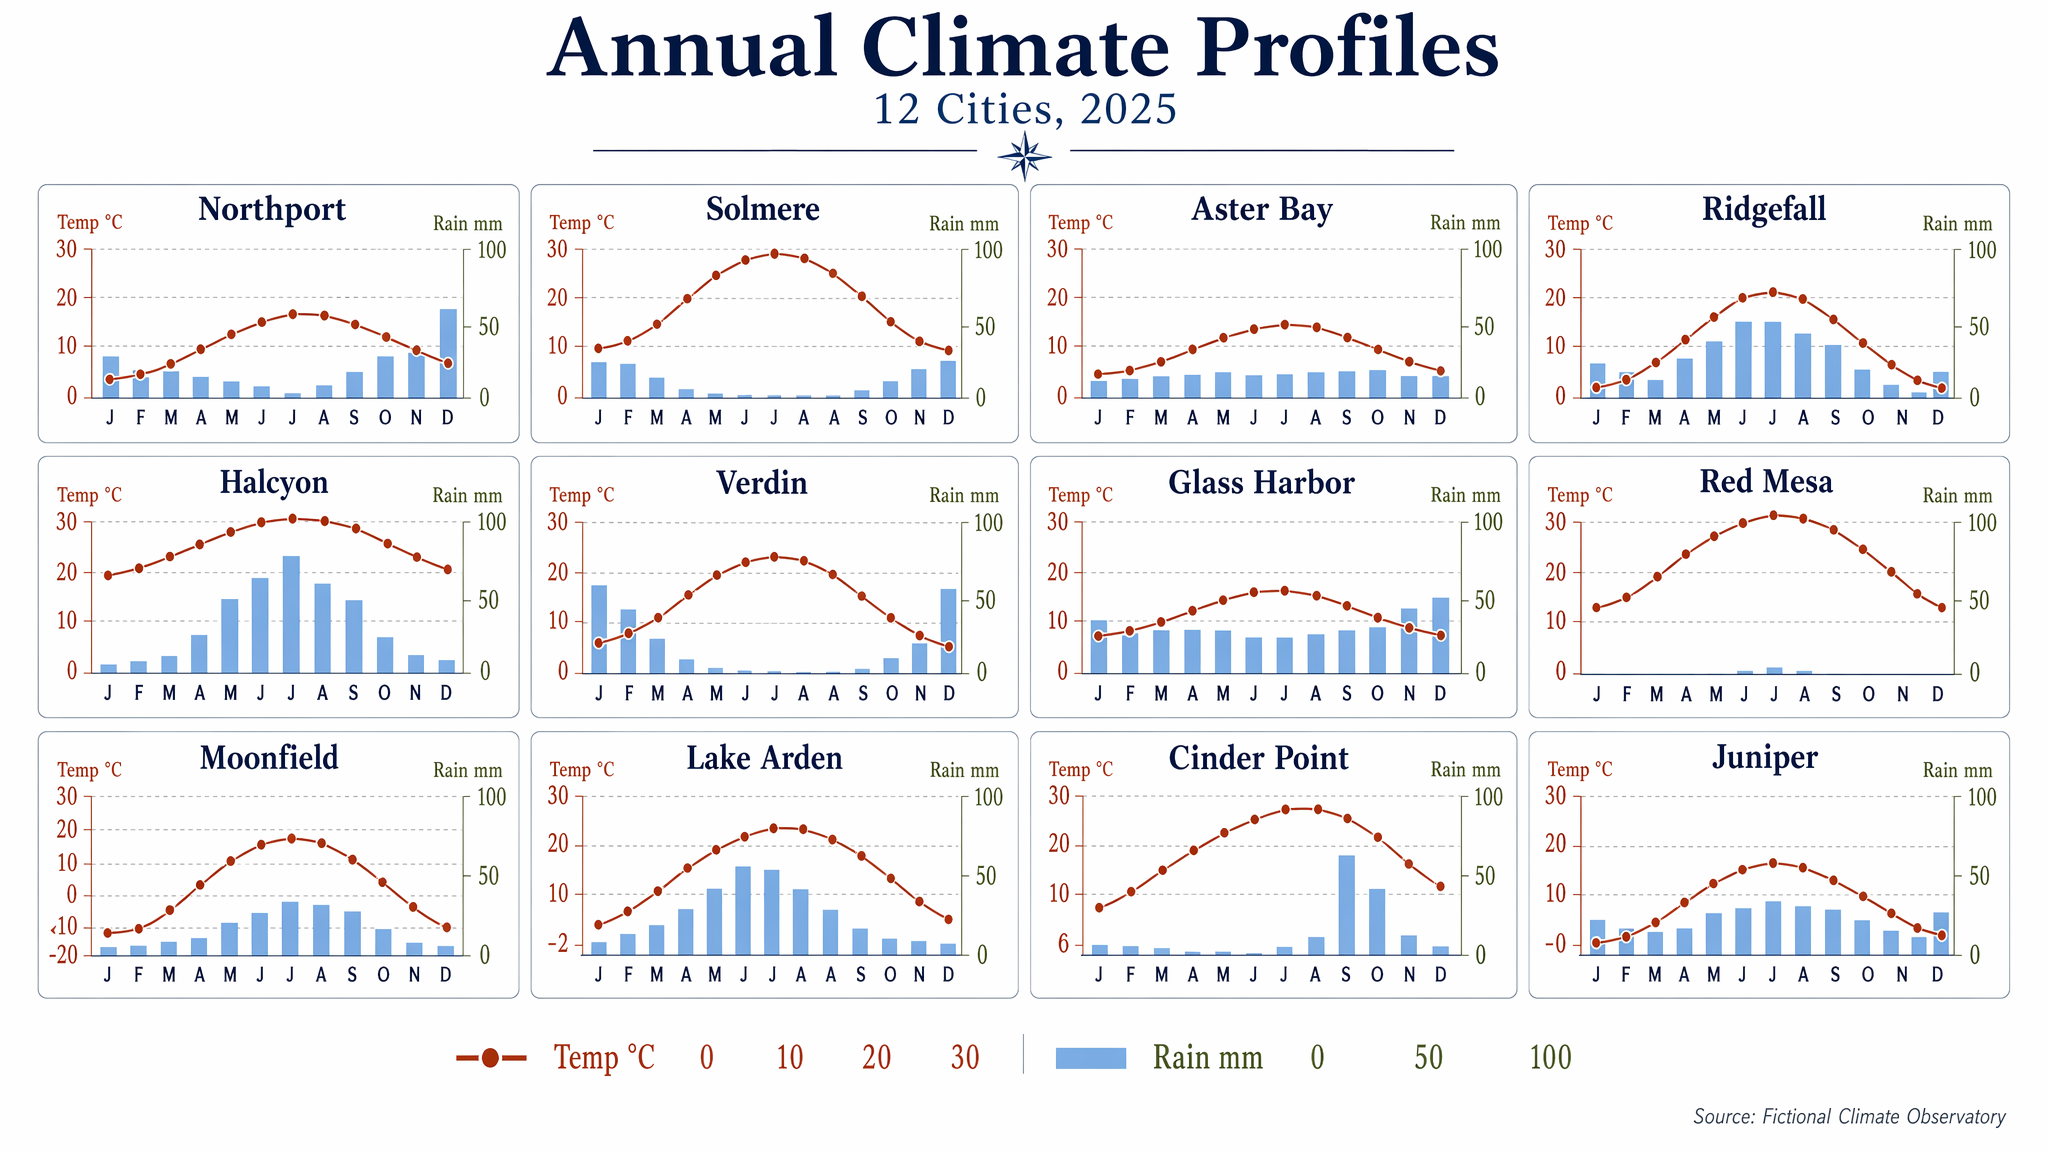
Produce a clean editorial data visualization poster showing a 4x3 small-multiples grid of monthly climate charts for 12 fictional cities. Use a white background, generous margins, and a restrained palette of navy, rust, sky blue, olive, and charcoal. Each mini-panel should contain a temperature line and precipitation bars with consistent axes and ultra-legible labels. Include a title block with the in-image text "Annual Climate Profiles" and subtitle "12 Cities, 2025". Label panels "Northport", "Solmere", "Aster Bay", "Ridgefall", "Halcyon", "Verdin", "Glass Harbor", "Red Mesa", "Moonfield", "Lake Arden", "Cinder Point", and "Juniper". Use month labels "J F M A M J J A S O N D" and axis labels "Temp °C" and "Rain mm". Add numeric legend values "0", "10", "20", "30", and "100". Keep the composition highly structured, scientifically clear, and visually elegant, with crisp typography, aligned scales, and publication-grade chart rendering.
Catatan Hasil
这个案例已从 GPT-Image2-Skill README 迁入 AIPlusLab `/prompts`,方便在站内直接检索、浏览和复用。
ModelGPT-Image-2
Kategori图片
JenisKes
Sumberopenai