案例GPT-Image-2图片数据可视化
GPT-Image-2 案例 · 网络图协作地图
来自“数据可视化”精选展示的 GPT-Image-2 参考案例,适合检索“网络图协作地图”方向的生成效果。
成果
案例背景
来自 GPT-Image2-Skill README 的精选展示条目,适合作为“数据可视化 / 网络图协作地图”方向的站内参考案例。
提示词内容
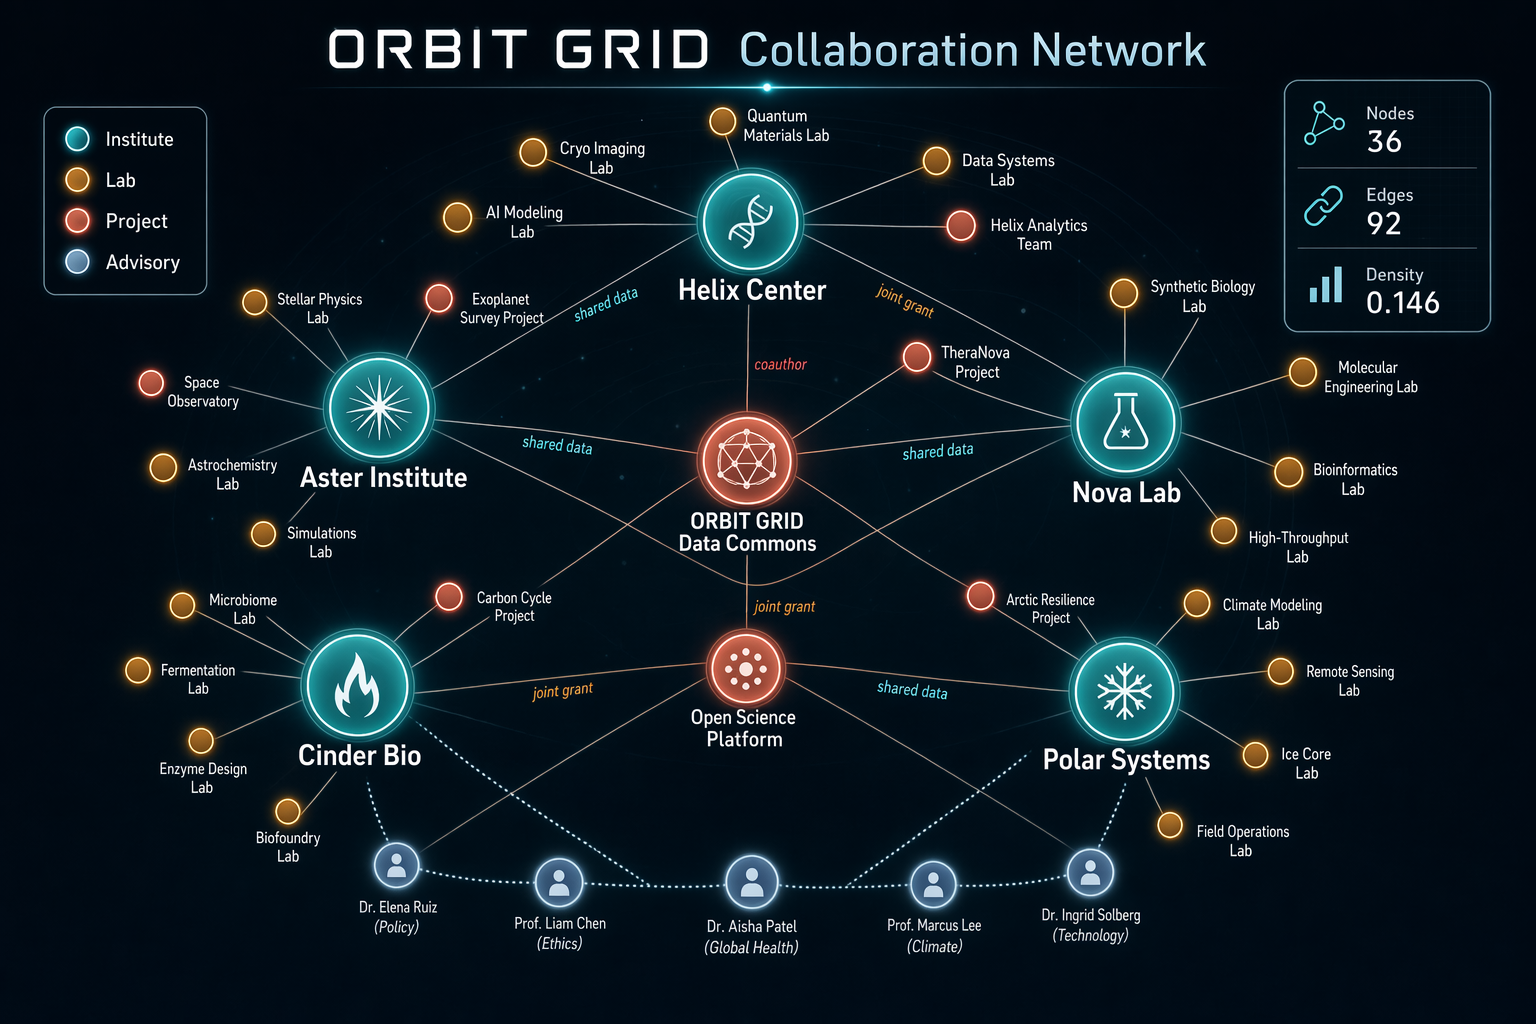
Generate a sophisticated network graph visualization on a dark charcoal canvas showing collaborations across a fictional research consortium called ORBIT GRID. Use glowing node colors in teal, amber, coral, pale blue, and white, with fine connecting lines and clean labels. The composition should be balanced, readable, and intentionally designed rather than random. Include a title in crisp text reading "ORBIT GRID Collaboration Network" and a legend with "Institute", "Lab", "Project", and "Advisory". Show approximately 36 nodes, with larger hubs labeled "Helix Center", "Nova Lab", "Aster Institute", "Cinder Bio", and "Polar Systems". Add edge labels sparingly, such as "shared data", "joint grant", and "coauthor". Include a right-side stats card reading "Nodes 36", "Edges 92", and "Density 0.146". Emphasize clean hierarchy, accurate node-label placement, anti-overlap spacing, subtle depth, and crisp typography suited for a polished technical visualization generated by gpt-image-2.
结果说明
这个案例已从 GPT-Image2-Skill README 迁入 AIPlusLab `/prompts`,方便在站内直接检索、浏览和复用。
模型GPT-Image-2
分类图片
类型案例
来源openai